
Capture WebGL Applications using RenderDoc and SpectorJS
Graphics applications on desktop and mobile platforms can be conveniently debugged and studied using tools like Nsight, RenderDoc, Arm Performance Studio, and Snapdragon Profiler. When we discover some interesting graphical applications on the internet and want to understand the underlying algorithms through their source code and rendering pipeline, RenderDoc and Spector.js are great tools. This article provides a brief overview of the process of capturing WebGL frames using RenderDoc, mainly as a reminder for future reference.
Prerequisite
Chrome (version before March 2023): The reasons for this are explained in the postscript.
Steps
-
Download the webpage content locally, including the HTML file, related CSS, JavaScript, and other assets. Note: For some complex webpages, dynamically loaded resources by JavaScript may not be directly downloaded, so you’ll need to use Developer Tools to manually download them.
-
Start a local HTTP server (e.g., Python HTTP server, Node.js HTTP server, or any other method you prefer).
- To allow RenderDoc to better capture and analyze the rendered frame data, certain settings need to be configured before accessing the webpage in the browser. You can package the following bash code into a
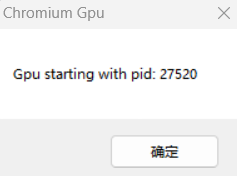
.batfile and run it. Explanations are provided in the postscript.set RENDERDOC_HOOK_EGL=0 "PathToYourChromeEXE\chrome.exe" http://localhost:5500/pagename.html --disable-gpu-sandbox --gpu-startup-dialog --disable-direct-composition --disable-web-security --user-data-dir=PathToYourWebApp - A popup window will show the Chrome process PID after launching. Do not close this window and record the PID.
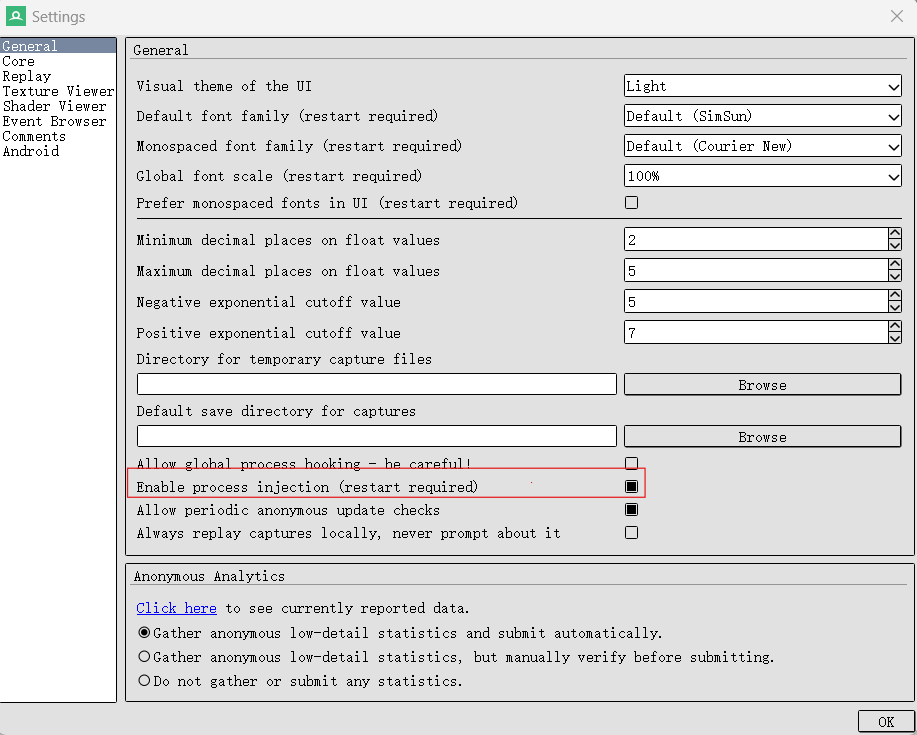
- Set up RenderDoc by going to Tools -> Settings and enabling process injection.
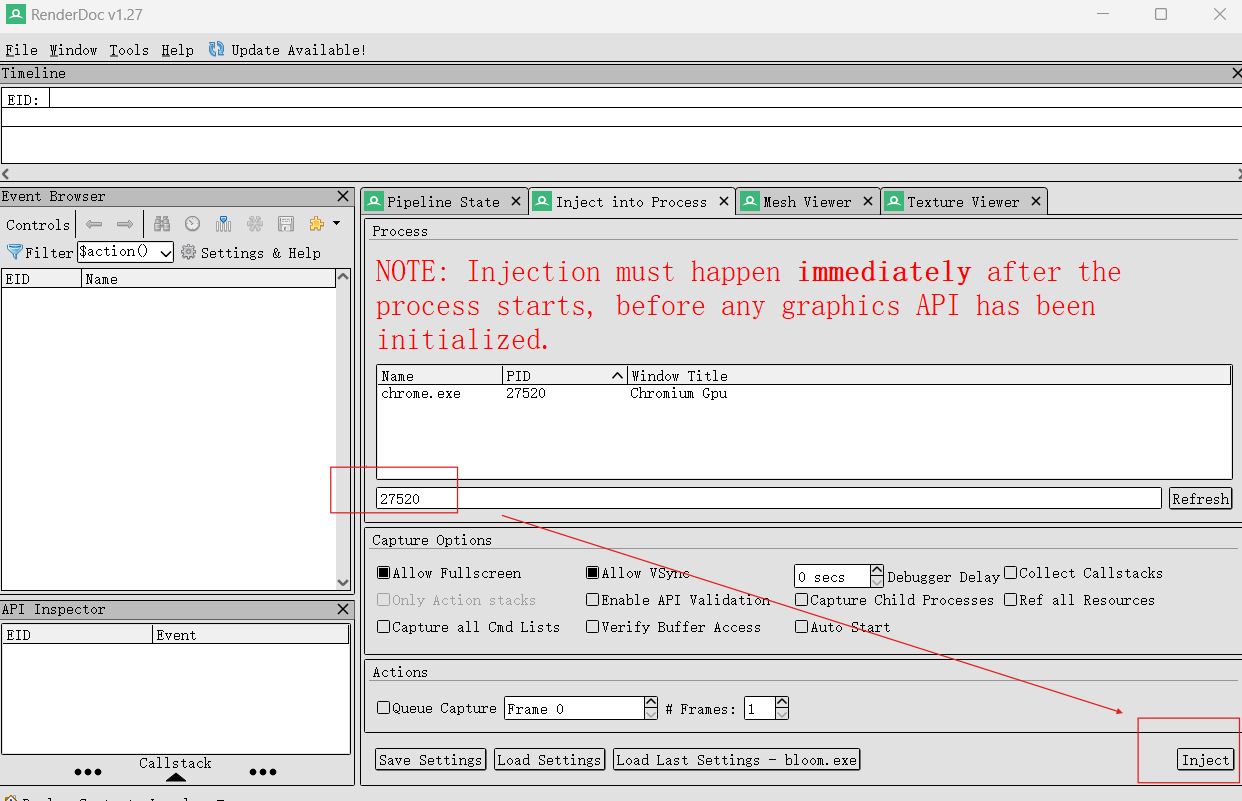
- Restart RenderDoc, go to File -> Inject into process, search for the PID, and inject.
-
Resume the Chrome process (click “OK” on the Chrome process PID popup).
-
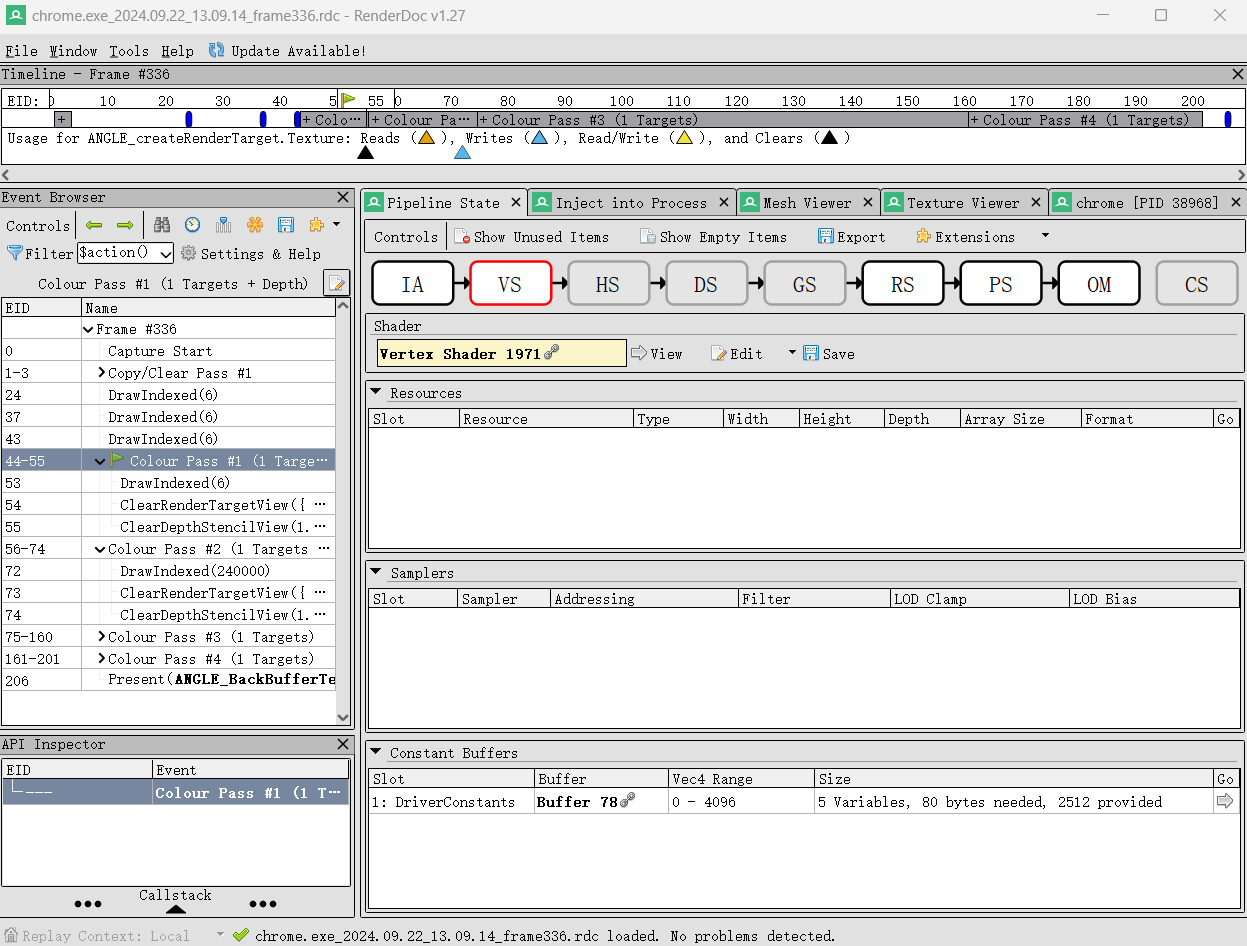
Capture the frame and view the rendering pipeline.
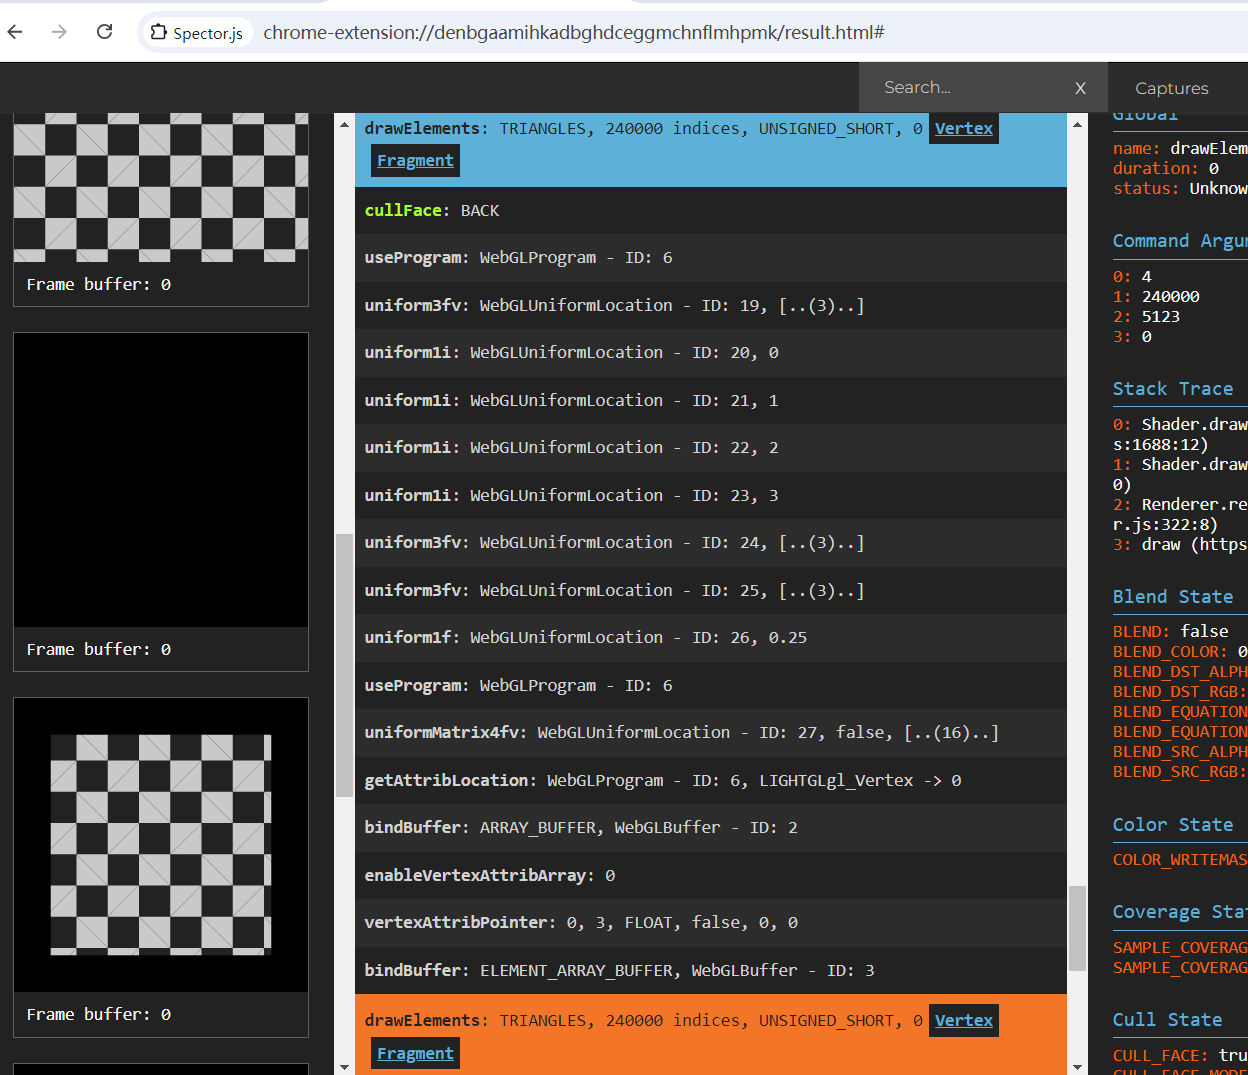
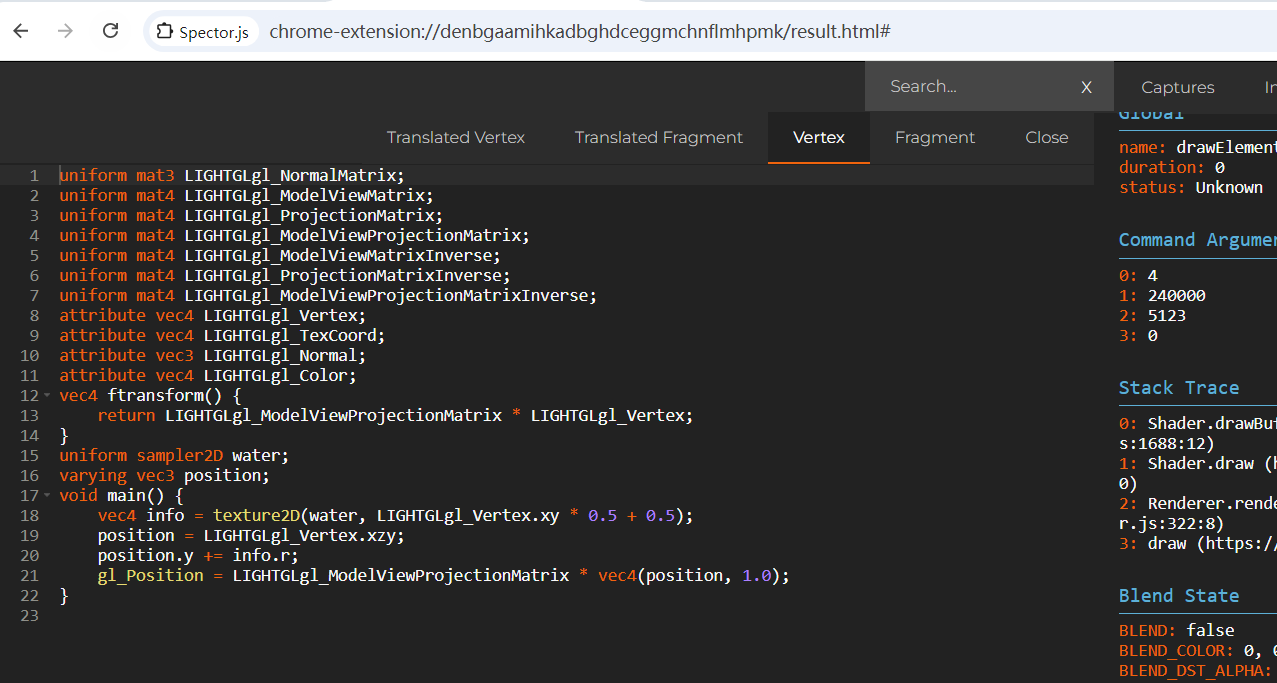
Spector.js
Spector.js is a powerful plugin that can also debug WebGL applications and view the shader code used in the rendering process. However, the commands shown for rendering calls in its frame capture can be overly detailed, making it difficult to observe. RenderDoc, on the other hand, provides better readability for viewing the overall pipeline, although its downside is that the shader code may not always be viewable or editable. The two tools complement each other well and can be used together.
Postscript
- Why use a version of Chrome before March 2023 with RenderDoc to capture frames of web applications?
- Older versions of Chrome used OpenGL or Angle as the rendering API, which had better compatibility with RenderDoc. After 2023, Chrome gradually shifted towards WebGPU and other backends such as Vulkan or Direct3D12, which are not yet fully integrated with RenderDoc.
- Modern versions of Chrome have enhanced protection for user data and processes, requiring higher privileges or additional setup for many debugging tools.
- In newer versions of Chrome, graphics rendering may have been completely decoupled from the main browser or rendering process or encapsulated in stricter sandboxes, making it harder for RenderDoc to inject into the rendering pipeline for capture.
- Explanation of the settings:
set RENDERDOC_HOOK_EGL=0: Prevents RenderDoc from intercepting EGL calls.--disable-gpu-sandbox: Disables the GPU sandbox mechanism, allowing RenderDoc to access the GPU rendering context.--gpu-startup-dialog: Pauses the process during GPU initialization to get the PID, enabling RenderDoc’s process injection feature.--disable-direct-composition: Disables DirectComposition, which can prevent conflicts between complex hardware acceleration and debugging tools, simplifying the debugging process.--disable-web-security: Disables the browser’s same-origin policy and other web security features, allowing cross-origin resource requests, suitable for local development or testing environments, but not recommended for production!
The content of this blog post is original to the author. Please indicate the source and include the original link when reproducing it. Thank you for your support and understanding.